PRACTICAL GUIDE
How to analyse your trading performance
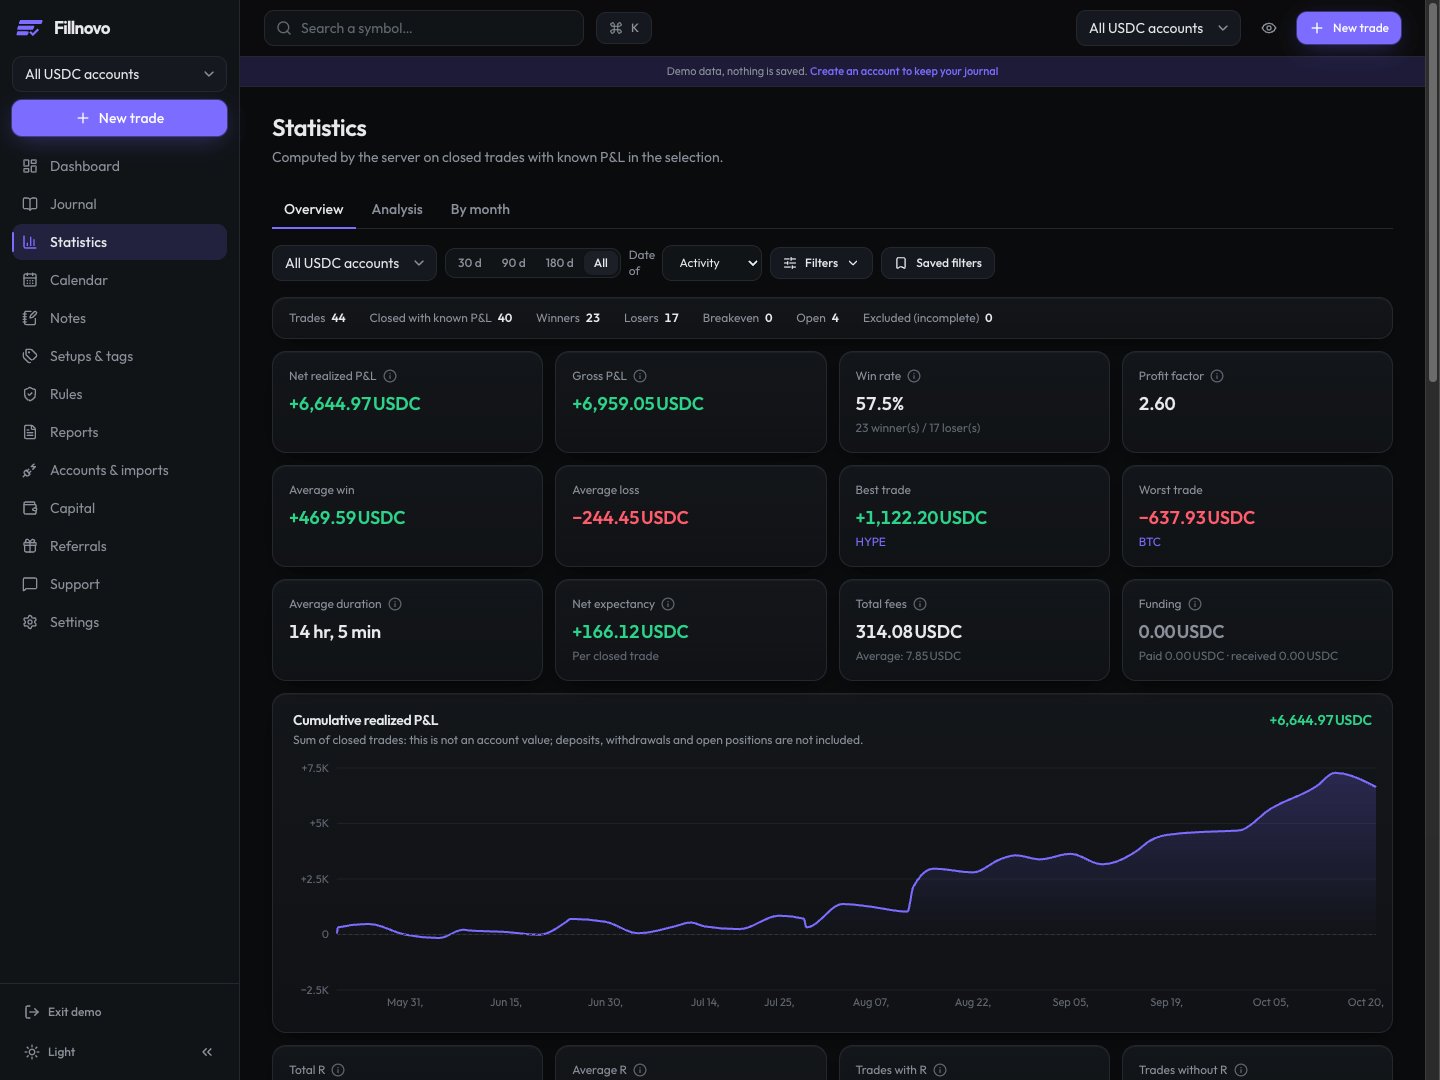
To analyse performance in Fillnovo, choose an account and period in Statistics, check the included trades, then compare the results with your notes. A metric describes your history; it does not predict your next trade.
- 1. Check the selection and exclusions
- 2. Read metrics together
- 3. Distinguish the curve from an account balance
1. Check the selection and exclusions
Result statistics use closed trades with known P&L. Check the account, currency, period and date basis: opening, closing or activity. Keep open or incomplete trades separate from this sample. Total and average R use only trades with an available R value: check their count before comparing.
2. Read metrics together
In Fillnovo, win rate is winners divided by winners plus losers; breakeven trades are excluded from this ratio. Profit factor divides total net gains by the absolute total net losses. Net expectancy is average net P&L per closed trade with known P&L. Check fees and funding too: a source that omits them can leave results incomplete.
3. Distinguish the curve from an account balance
The cumulative realized P&L curve adds up closed-trade results. It does not represent deposits, withdrawals or open positions. A decline here is a fall in cumulative realized results. Compare matching periods and filters; a small sample or one exceptional win can dominate the picture.
Worked example with fictional data
- Four closed trades: +120, +80, −50 and −50, after all costs, in one currency. Net P&L: +100; win rate: 2 / 4 = 50%; profit factor: 200 / 100 = 2; net expectancy: 100 / 4 = +25.
- These four observations illustrate the calculation, not the reliability of a method. In your journal, review notes and exclusions before attributing the result to a setup.